Statistics [04]: Some Common Continuous Distributions
Published:
This post will summarize some of the commonly used continuous distributions, including
- Uniform distribution
- Exponential distribution
- Weibull distribution
- Normal distribution
distribution
- Student’s t-distribution
- F-distribution
- Gamma distribution
- Beta Distribution
Uniform Distribution
A uniform distribution, sometimes also known as a rectangular distribution, is a distribution that has constant probability. The probability density function and cumulative distribution function for a continuous uniform distribution on the interval are


Exponential Distribution
Poisson distribution describes the the number of events occurring over a period of time, where the non-overlapping intervals are independent. Exponential distribution describes the distribution of waiting times between successive changes.
Given a Possion distribution with parameter , the distribution of waiting time would be
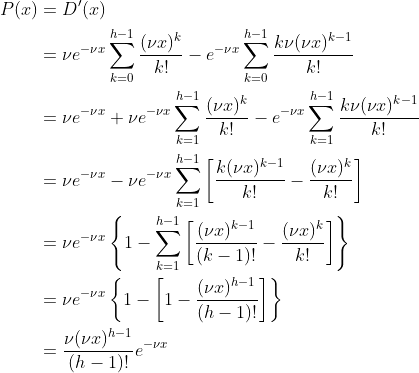
and the probability distribution function would be
Like geometric distribution, exponential distribution is memoryless.
Weibull Distribution
Expotential distribution can be seen as a special form of Weibull distribution, whose cumulative distribution function has the following form:
and the probability distribution function would be
where is called scale parameter, and
is called shape parameter. Depending on its value, Weibull distribution can approximate various, even very different shapes. It is suitable for the characterization of time to failure as well as strength or load.
Normal Distribution
Normal distribution is the most commonly used distribution in our life. It has the following probability density function.
where and
are mean and variance of
respectively.
The so-called standard normal distribution is given by and
in the general normal distribution. An arbitrary normal distribution can be converted to a standard normal distribution by changing variables to
, yielding
Based on the standard normal distribution, the cumulative distribution can then be found utilizing the lookup table.
Chi-Squared Distribution
If have normal independent distributions with mean 0 and variance 1, then
is a distribution with
degrees of freedom.
More generally, if are independently distributed according to a
distribution with
degrees of freedom, then
is distributed according to with
degrees of freedom.
Student’s t-Distribution
Let be independently and identically drawn from the distribution
. Let
be the sample mean and
be the sample variance. The the random variable
has a Student’s t-distribution with degrees of freedom.
The only difference of Student’s t-distribution with standard normal distribution is that the in standard normal distribution is replaced with
. As
increases, Student’s t-distribution approaches the normal distribution.
F-Distribution
F-distribution arises to test whether two observed samples has the same variance. Let and
be independent
distribution with
and
degrees of freedom respectively.
The ratio of the two distributions
has an F-distribution with degrees of freedom and
.
Gamma Distribution
Exponential distribution describes the distribution of waiting times between successive changes, whereas Gamma distribution describes the distribution of waiting times until the Possion event happens. Therefore,
where
is a complete gamma function, and
The corresponding probability function would be

Let and
, then
which is the probability function for the gamma distribution.
Beta Distribution
The Beta distribution is used as a prior distribution for binomial proportions in Bayesian analysis (see binomial distribution in this post).
The probability function of Beta distribution is given by
and the cumulative distribution function is
The image below gives plots for and
ranging from 0.25 and 3.00.
Table of Contents
- Probability vs Statistics
- Shakespear’s New Poem
- Some Common Discrete Distributions
- Some Common Continuous Distributions
- Statistical Quantities
- Order Statistics
- Multivariate Normal Distributions
- Conditional Distributions and Expectation
- Problem Set [01] - Probabilities
- Parameter Point Estimation
- Evaluation of Point Estimation
- Parameter Interval Estimation
- Problem Set [02] - Parameter Estimation
- Parameter Hypothesis Test
- t Test
- Chi-Squared Test
- Analysis of Variance
- Summary of Statistical Tests
- Python [01] - Data Representation
- Python [02] - t Test & F Test
- Python [03] - Chi-Squared Test
- Experimental Design
- Monte Carlo
- Variance Reducing Techniques
- From Uniform to General Distributions
- Problem Set [03] - Monte Carlo
- Unitary Regression Model
- Multiple Regression Model
- Factor and Principle Component Analysis
- Clustering Analysis
- Summary


Comments