
Statistics [16]: Summary of Statistical Tests
Published:
Cheat sheet of statistical tests.
Purpose of Statistical Tests
Statistical tests are used to:
- determine whether a predictor variable has a statistically significant relationship with an outcome variable.
- estimate the difference between two or more groups.
Statistical tests assume a null hypothesis of no relationship or no difference between groups. Then they determine whether the observed data fall outside of the range of values predicted by the null hypothesis.
If the value of the test statistic is more extreme than the statistic calculated from the null hypothesis, then a statistically significant relationship between the predictor and outcome variables can be inferred. Otherwise, no statistically significant relationship could be inferred.
Parametric Statistical Tests
Comparison Tests
T-tests are used when comparing the means of precisely two groups (e.g. the average heights of men and women). ANOVA and MANOVA tests are used when comparing the means of more than two groups.
| Predictor Variable | Outcome Variable | |
|---|---|---|
| Independent | Categorical; 1 predictor | Quantitative; Groups from the same population |
| Paired | Categorical; 1 predictor | Quantitative; Groups from different populations |
| ANOVA | Categorical; 1 or more predictor | Quantitative; 1 outcome |
| MANOVA | Categorical; 1 or more predictor | Quantitative; 2 or more outcomes |
Regression Tests
Regression tests look for cause-and-effect relationships. They can be used to estimate the effect of one or more continuous variables on another variable.
| Predictor Variable | Outcome Variable | |
|---|---|---|
| Simple linear regression | Continous; 1 predictor | Continous; 1 outcome |
| Multiple linear regression | Continous; 2 or more predictors | Continous; 1 outcome |
| Logistic regression | Continous; 1 or more predictor | Binary |
Correlation Tests
Correlation tests check whether variables are related without hypothesizing a cause-and-effect relationship. These can be used to test whether two variables used in a multiple regression test are autocorrelated.
| Variables | |
|---|---|
| Pearson’s | 2 continous variables |
Variance Homogeneity Test
| Requirements | |
|---|---|
| Hartley test | Number of the independent tests under |
| Bartlett test | Number of the independent tests under |
Non-Parametric Statistical Tests
| Predictor Variable | Outcome Variable | Use In Place Of … | |
|---|---|---|---|
| Spearman’s | Quantitative | Quantitative | Pearson’s |
| Categorical | Categorical | Pearson’s | |
| Sign test | Categorical | Quantitative | One-sample |
| Kruskal–Wallis | Categorical; | Quantitative | ANOVA |
| ANOSIM | Categorical; | 2 or more outcome variables | MANOVA |
| Wilcoxon Rank-Sum test | Categorical; 2 groups | Quantitative; groups from different populations | Independent |
| Wilcoxon Signed-rank test | Categorical; 2 groups | Quantitative; groups from the same population | Paired |
Flow Chart
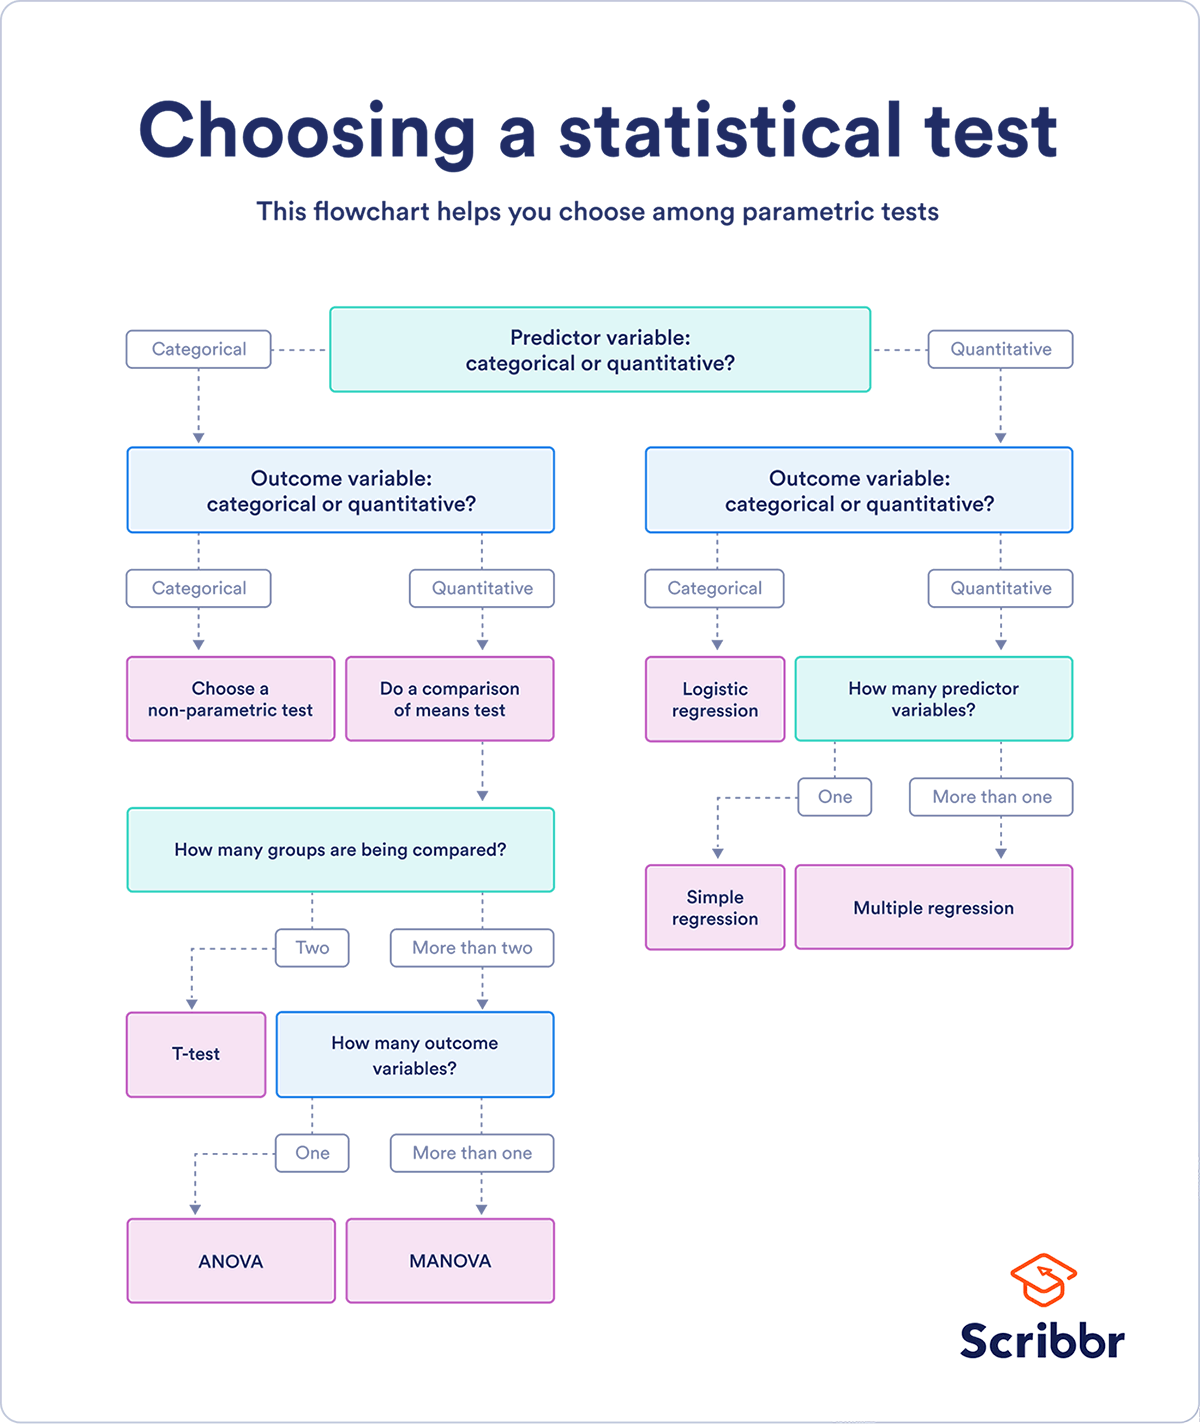
Table of Contents
- Probability vs Statistics
- Shakespear’s New Poem
- Some Common Discrete Distributions
- Some Common Continuous Distributions
- Statistical Quantities
- Order Statistics
- Multivariate Normal Distributions
- Conditional Distributions and Expectation
- Problem Set [01] - Probabilities
- Parameter Point Estimation
- Evaluation of Point Estimation
- Parameter Interval Estimation
- Problem Set [02] - Parameter Estimation
- Parameter Hypothesis Test
- t Test
- Chi-Squared Test
- Analysis of Variance
- Summary of Statistical Tests
- Python [01] - Data Representation
- Python [02] - t Test & F Test
- Python [03] - Chi-Squared Test
- Experimental Design
- Monte Carlo
- Variance Reducing Techniques
- From Uniform to General Distributions
- Problem Set [03] - Monte Carlo
- Unitary Regression Model
- Multiple Regression Model
- Factor and Principle Component Analysis
- Clustering Analysis
- Summary
Comments