
Statistics [19]: Python [03] - Chi-Squared Test
Published:
Python realization of tests, including one-way
test and
independencae test.
One-Way Chi-Square Test
scipy.stats.chisquare(f_obs, f_exp=None, ddof=0, axis=0)
The chi-square test tests the null hypothesis that the categorical data has the given frequencies. It return the statistic and the
value.
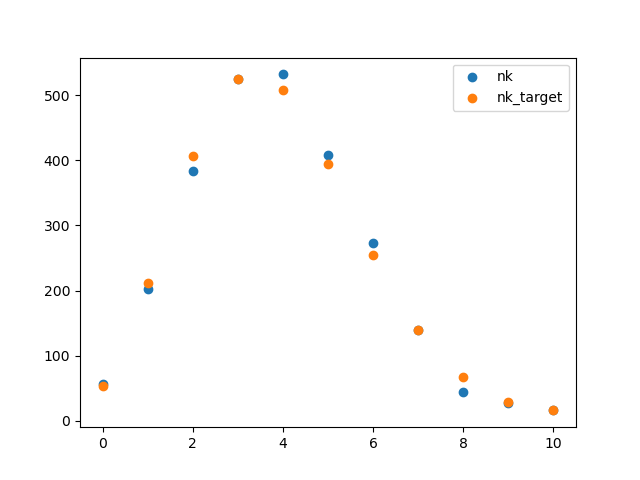
Data
Let’s look at the Example 1 in this post.
| 0 | 1 | 2 | 3 | 4 | 5 | 6 | 7 | 8 | 9 | ||
|---|---|---|---|---|---|---|---|---|---|---|---|
| 57 | 203 | 383 | 525 | 532 | 408 | 273 | 139 | 45 | 27 | 16 | |
| 54 | 211 | 407 | 525 | 508 | 394 | 254 | 140 | 68 | 29 | 17 |
The purpose is to confirm whether the number of particles follows the Poisson distribution.
import numpy as np
import pandas as pd
data = [[0,1,2,3,4,5,6,7,8,9,10],[57,203,383,525,532,408,273,139,45,27,16],[54,211,407,525,508,394,254,140,68,29,17]]
dataDF = pd.DataFrame(np.transpose(data),columns = ['k','nk','nk_target'])
Plot
import matplotlib.pyplot as plt
plt.scatter(dataDF['k'],dataDF['nk'])
plt.scatter(dataDF['k'],dataDF['nk_target'])
plt.legend(['nk','nk_target'])
plt.show()
Chi-Squared Test
# one parameter needs to be estimated, hence, ddof = 1
chisq, p = ss.chisquare(dataDF['nk'],dataDF['nk_target'],ddof=1)
chisq, p
Result:
(12.921106842358597, 0.16620871010382665)
The value suggests that the differences are not significant. Therefore, the number of particles follows the Poisson distribution.
Chi-Square Independent Test
scipy.stats.chi2_contingency(observed, correction=True, lambda_=None)
This function computes the chi-square statistic and p-value for the hypothesis test of independence of the observed frequencies in the contingency table observed. The expected frequencies are computed based on the marginal sums under the assumption of independence. The number of degrees of freedom is dof = observed.size - sum(observed.shape) + observed.ndim - 1.
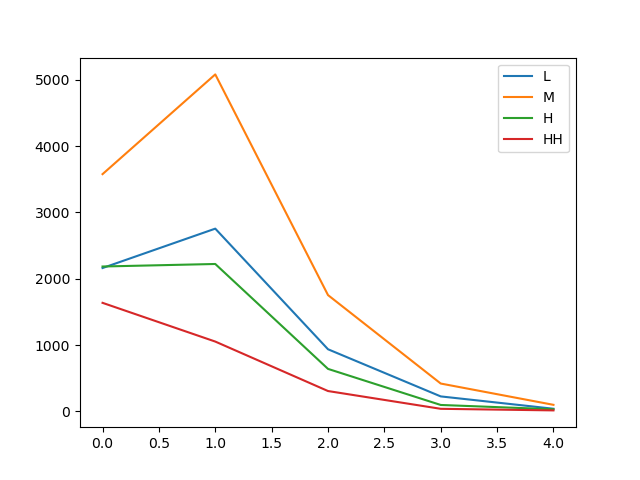
Data
Test the independence of income with respect to the number of kids in a family.
| kids \ income | 0-1 | 1-2 | 2-3 | 3 | SUM |
|---|---|---|---|---|---|
| 0 | 2161 | 3577 | 2184 | 1636 | 9558 |
| 1 | 2755 | 5081 | 2222 | 1052 | 11110 |
| 2 | 936 | 1753 | 640 | 306 | 3635 |
| 3 | 225 | 419 | 96 | 38 | 778 |
| 4 | 39 | 98 | 31 | 14 | 182 |
| SUM | 6116 | 10928 | 5173 | 3046 | 25263 |
data = np.array([[0,1,2,3,4],[2161,2755,936,225,39],[3577,5081,1753,419,98],[2184,2222,640,96,31],[1636,1052,306,38,14]])
dataDF = pd.DataFrame(np.transpose(data),columns = ['Num_Kids','L','M','H','HH'])
Plot
plt.plot(dataDF['Num_Kids'],dataDF['L'])
plt.plot(dataDF['Num_Kids'],dataDF['M'])
plt.plot(dataDF['Num_Kids'],dataDF['H'])
plt.plot(dataDF['Num_Kids'],dataDF['HH'])
plt.legend(['L','M','H','HH'])
plt.show()
Chi-Squared Test
chisq, p, dof, expected = ss.chi2_contingency(dataDF)
chisq, p
Result:
(568.5662976004844, 5.4281303038400445e-114)
The value suggests that the differences is very significant. Therefore, the number of kids in a family is strongly related with the income.
Table of Contents
- Probability vs Statistics
- Shakespear’s New Poem
- Some Common Discrete Distributions
- Some Common Continuous Distributions
- Statistical Quantities
- Order Statistics
- Multivariate Normal Distributions
- Conditional Distributions and Expectation
- Problem Set [01] - Probabilities
- Parameter Point Estimation
- Evaluation of Point Estimation
- Parameter Interval Estimation
- Problem Set [02] - Parameter Estimation
- Parameter Hypothesis Test
- t Test
- Chi-Squared Test
- Analysis of Variance
- Summary of Statistical Tests
- Python [01] - Data Representation
- Python [02] - t Test & F Test
- Python [03] - Chi-Squared Test
- Experimental Design
- Monte Carlo
- Variance Reducing Techniques
- From Uniform to General Distributions
- Problem Set [03] - Monte Carlo
- Unitary Regression Model
- Multiple Regression Model
- Factor and Principle Component Analysis
- Clustering Analysis
- Summary
Comments